Skip to content

WHOI HAB Hub

The WHOI HABHub is an open source data portal for region-scale integration and real time sharing of:

  • HAB species observations
  • Historic shellfish toxicity observations and closure notices
  • Shellfish toxicity predictions from sensor data (under development)
  • Visualizations of NOAA forecast model products (under development)

Interactive visualizations and capabilities include:

  • Data and forecast model products in maps and time series plots.
  • Interpret/translate raw sensor outputs.
  • Dynamic pop-up content and show/hide functionality.

Prototype layers populated with partial datasets include: 

  • Shellfish toxicity data collected by shellfish monitoring programs operated by ME, MA, and NH.
  • Shellfish closures enacted by state shellfish monitoring programs.
  • Sensor data collected by Imaging FlowCytobots deployments.

Ongoing efforts are focused on populating existing data layers and adding new prototype layers, standardizing datasets, and improving automated data ingestion.
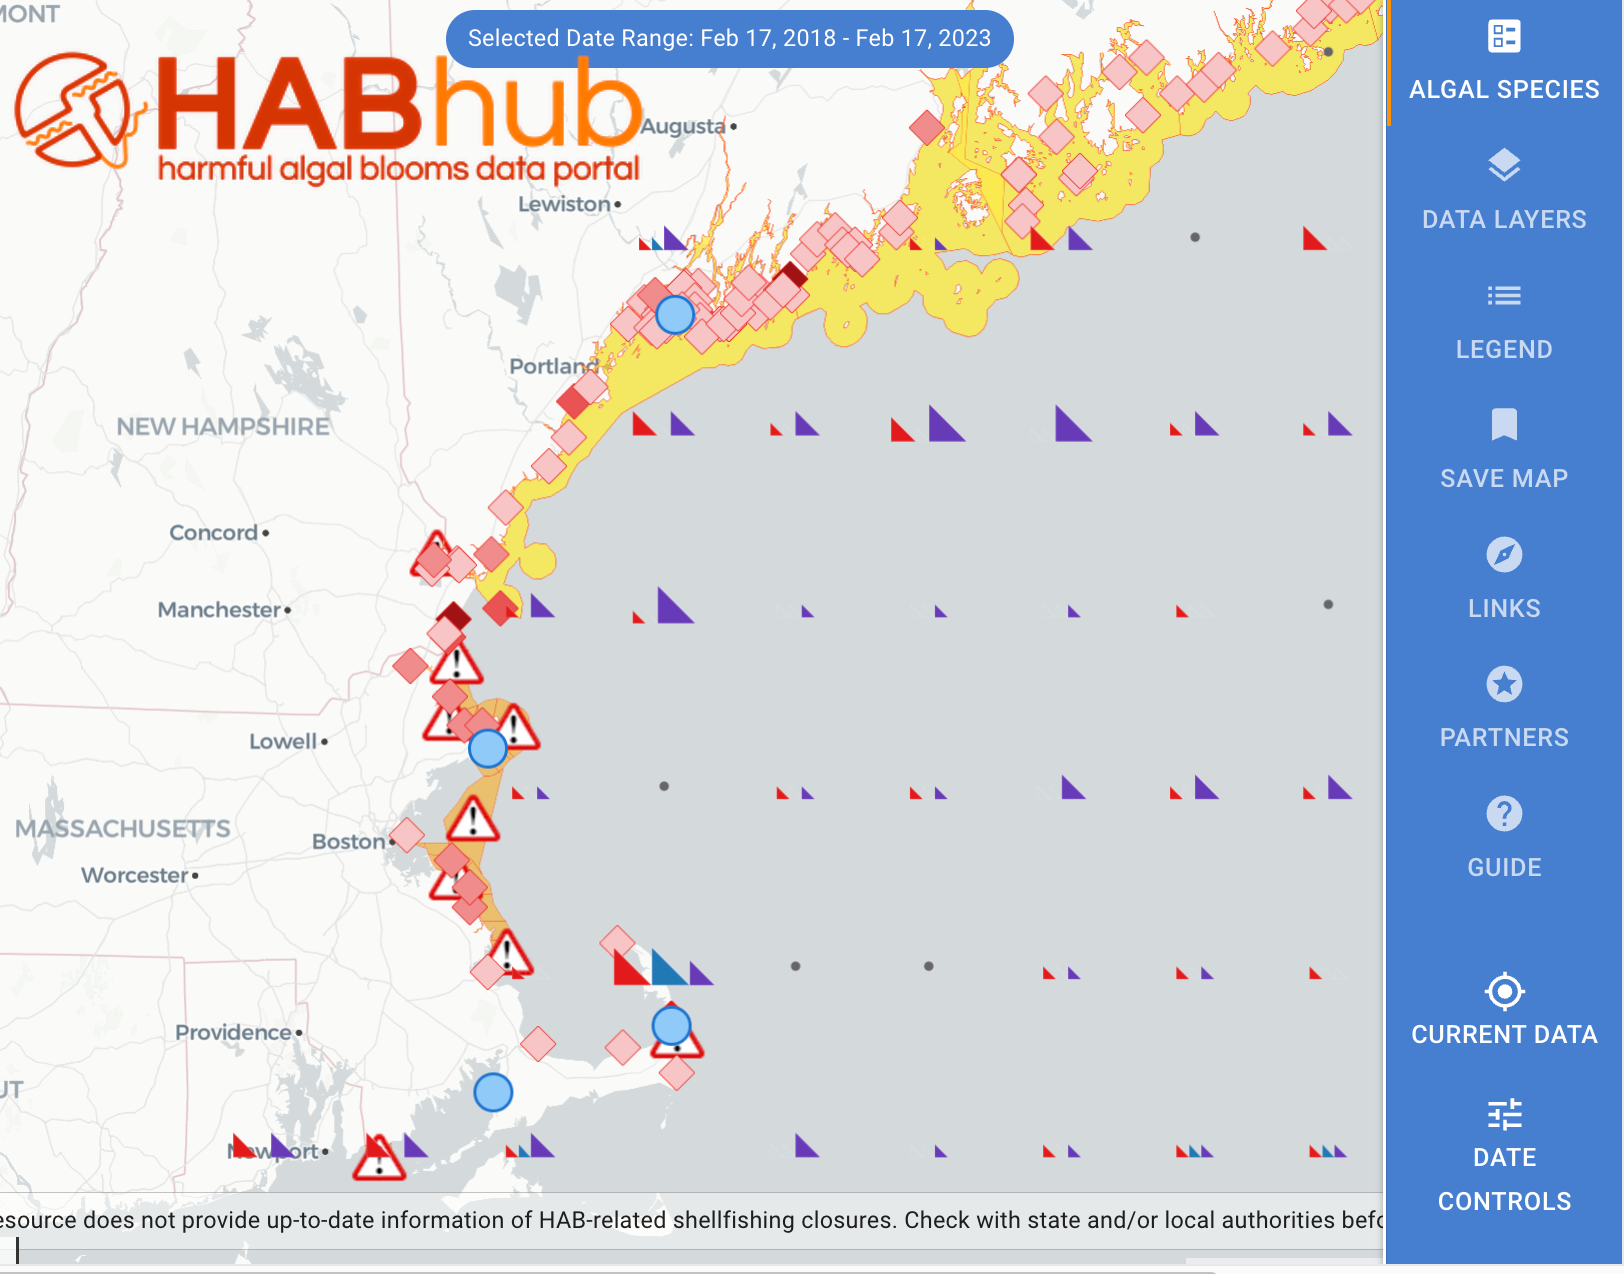
WHOI HABHub data prototype data layers include toxin monitoring data, shellfish closures, and Imaging Flowcytobot sensor data.

Visit the HABhub Guide

March 8, 2023

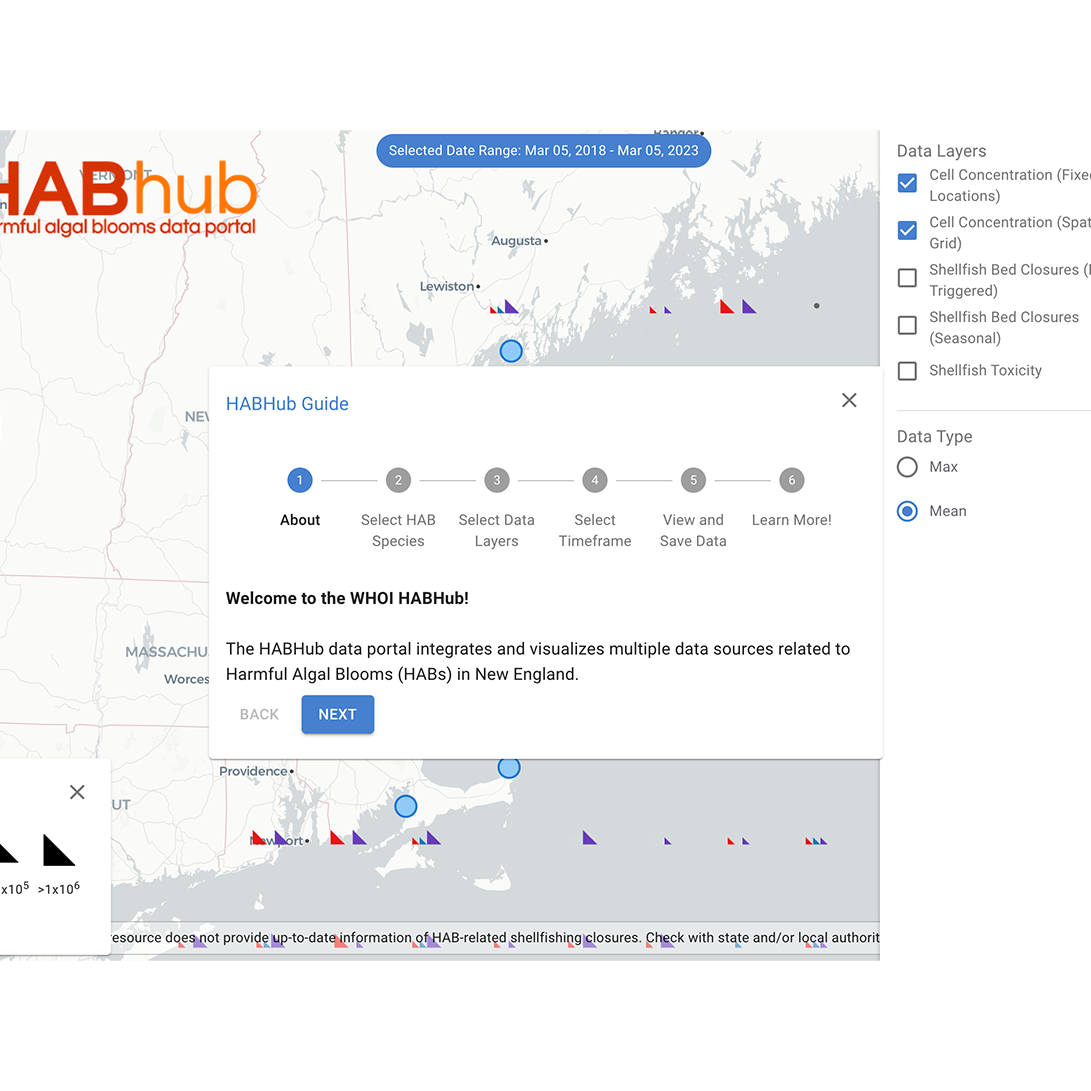
The HABhub guide provides a useful overview of the main functions and features of HABhub.  The guide can be accessed by clicking the “?” icon in the right-hand menu! The guide provides step-by-step instructions for accessing the main features of the HABHub menu, beginning with the “Algal Species” and “Data Layers” tabs, to “Select Timeframe”…

Read More

Timeframe Selection

March 7, 2023

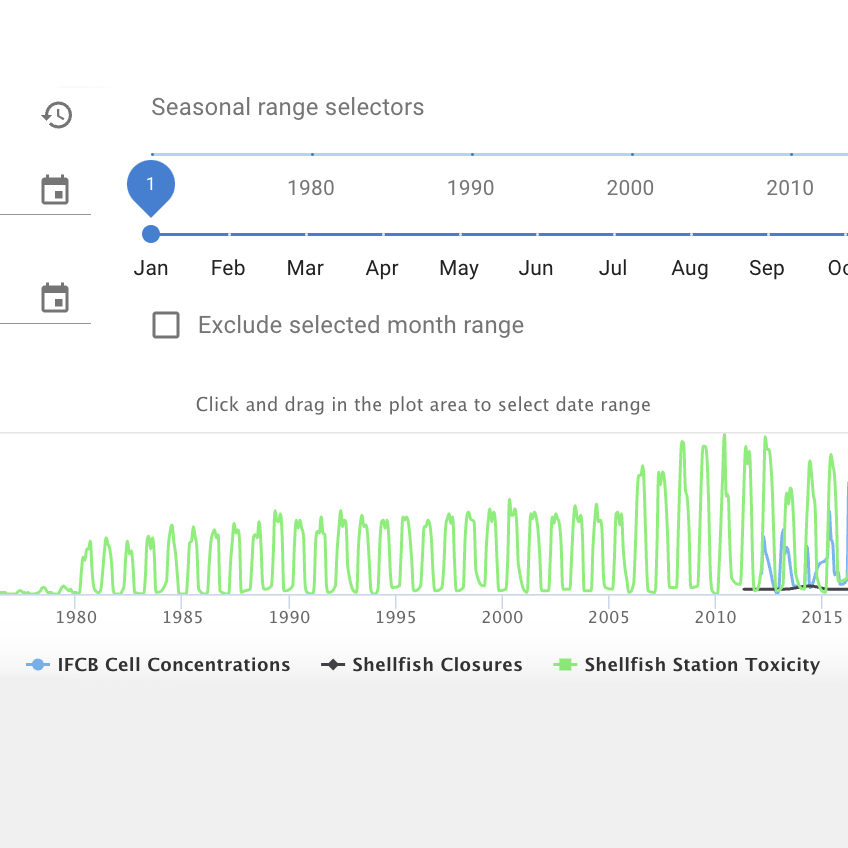
Another useful feature of the HABHub is the timeframe selector that allows users to view data from a particular timeframe, and to include – or exclude – certain months of the year (for example, excluding winter months). Select the “Date Controls” icon on the right-hand menu in the HABhub interface. The dialog box that pops…

Read More

Create IFCB Data Graphs

March 5, 2023

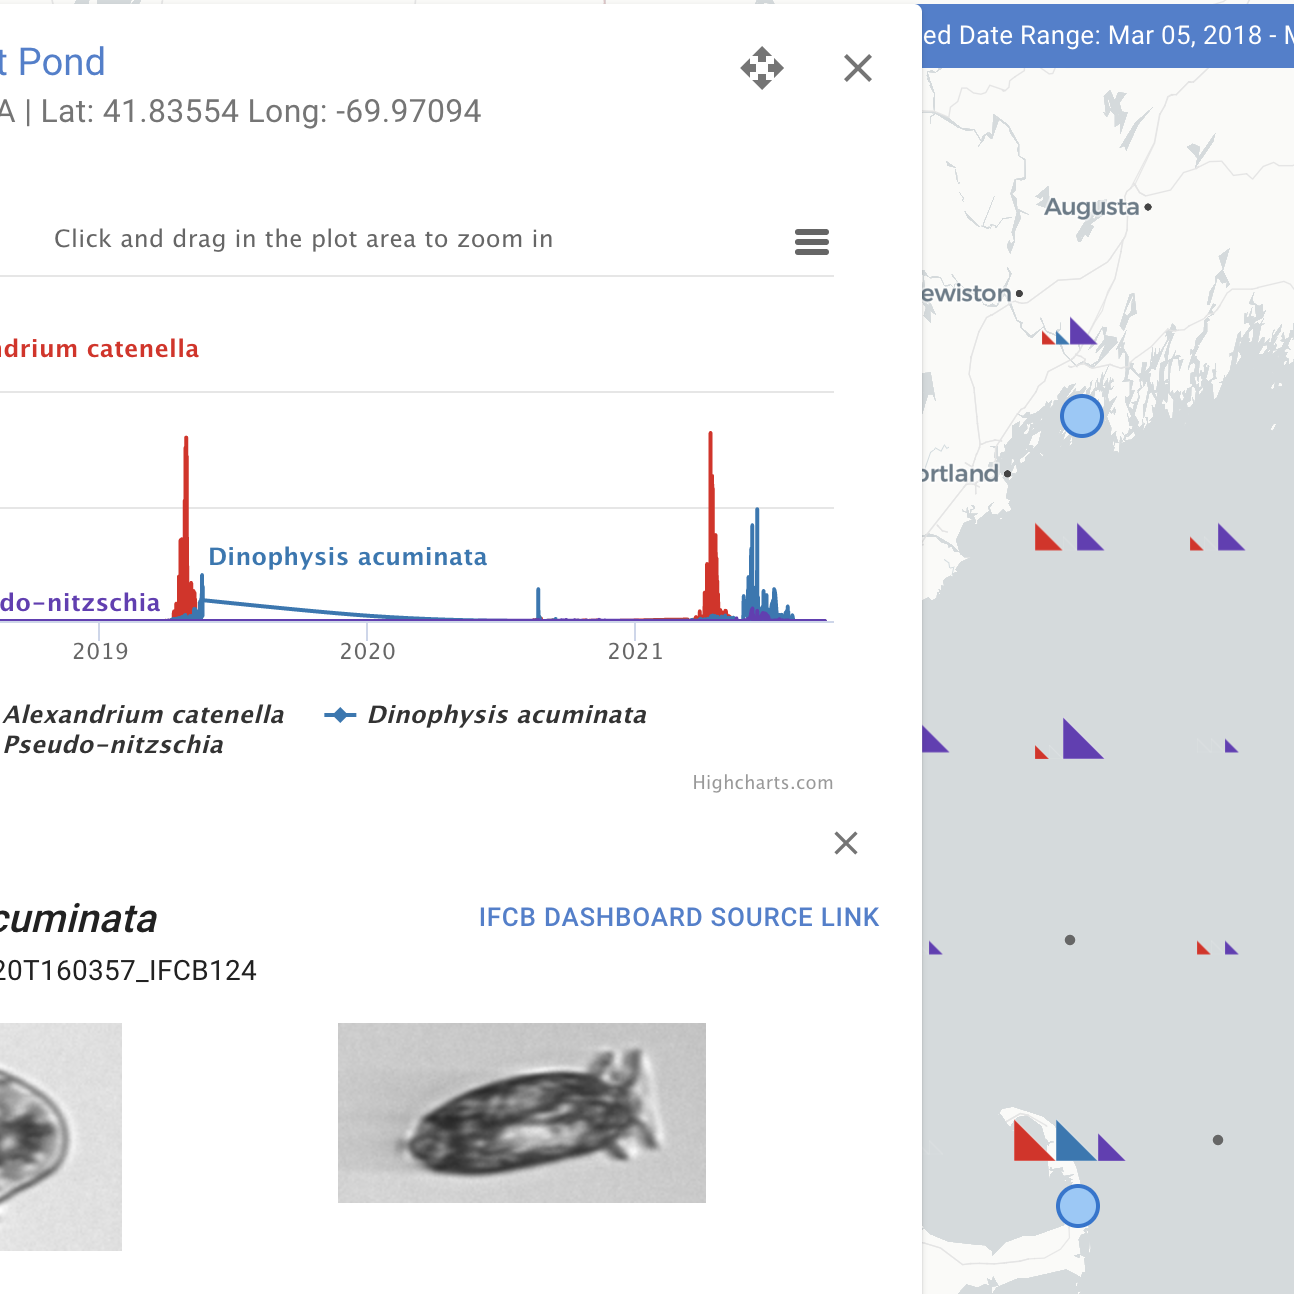
Another excellent feature on the HABHub is the capability to make graphs specifically based on IFCB data, and to see real photos of the algae taken on a date and time. The Imaging FlowCytobot is one of the strongest tools in HAB monitoring efforts, photographing and identifying every cell in the water samples it collects,…

Read More

Creating time series plots of toxin monitoring data

February 16, 2023

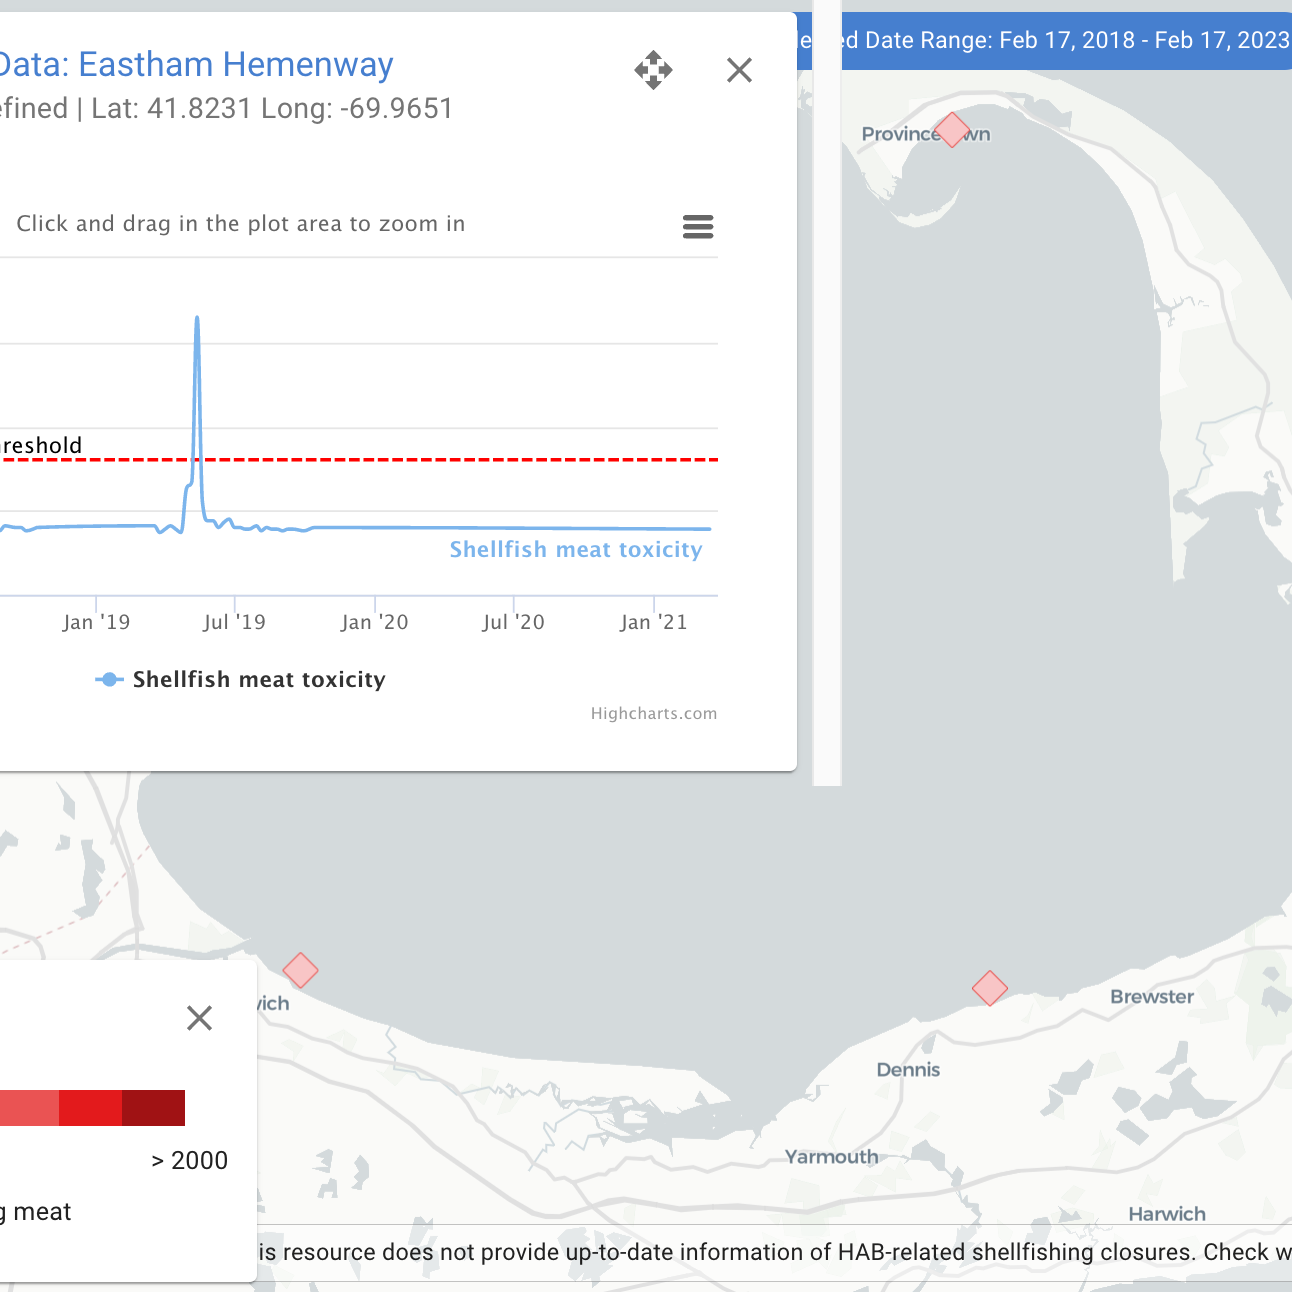
One useful feature of the HABHub is that it can produce downloadable graphs featuring specific data as configured by the user.   To explore this capability, visit the HABhub, and select either the “Cell Concentration” or “Shellfish Toxicity” data layers from the right-hand menu, and configure the date range using the “Date Controls” on the bottom…

Read More

Saving your Map

February 9, 2023

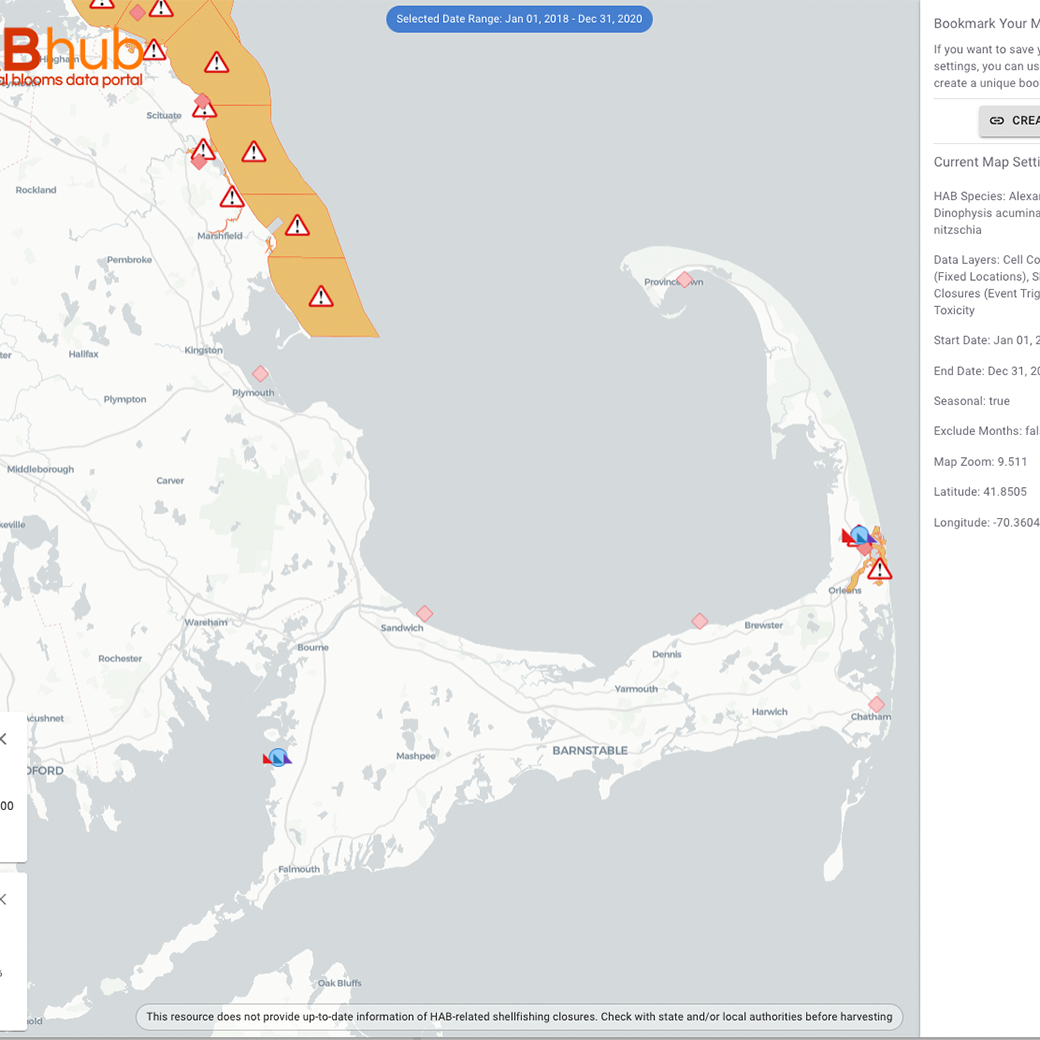
Saving your Map The “Save Map” tool is located in the right-hand menu bar, and allows users to save a particular map configuration (e.g., data layers selection, geographic zoom, and timeframe).  By clicking on the icon, users are provided a description of the current map settings, including visible species, active data layers, and both time…

Read More

Customizing your color palette

February 9, 2023

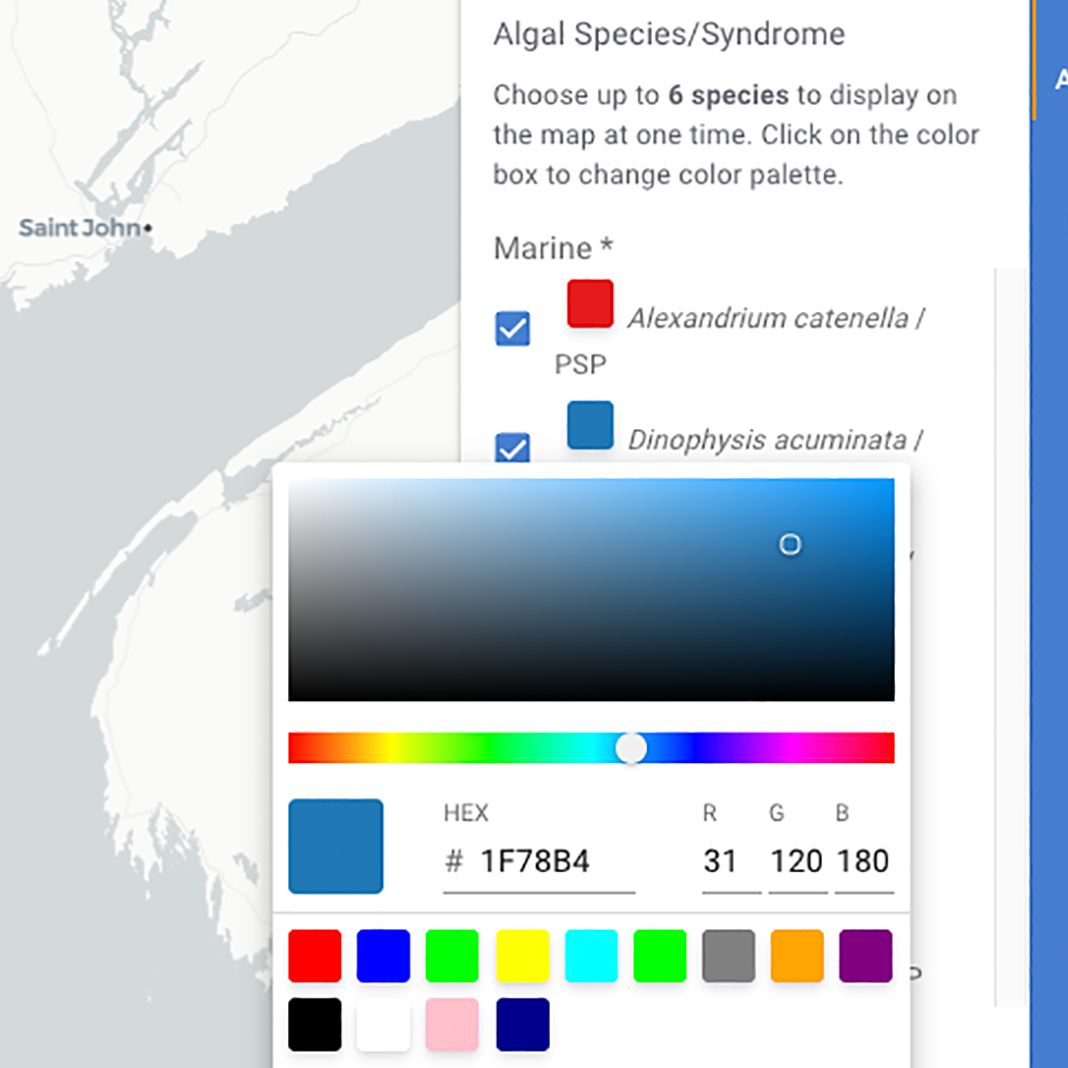
One exciting feature on the HABhub data layer interface is the color selection tool. In the “Algal Species” section of the right-hand menu, users can select up to six species to view on the map, and by clicking on the colored square next to the species name, can also change the display color of each…

Read More